bcStackP3: Stacked profiles from point layers 
V1.4 - 3 June 2019
This QGIS Processing algorithm creates stacked profiles from a point layer having the following fields: Fiducial, line and data. Stacked profiles are created in a new line layer.
In geophysics, stacked profiles are commonly used to display geophysical data (magnetic, gravity, electromagnetic, electric, radiometric, ...) over the lines on which the data has been acquired.
Correctly displayed they will show trends and anomalous areas that can be of interest.
Distributed under the GPL licence
This algorithm works only on QGIS version 3.x.
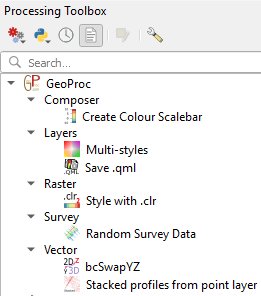
This algorithm is part of the Processing geoprocAlgos plugin. Once installed the geoprocAlgos plugin can be found in the 'Processing toolbox'.
Please report any bug/problem/wish on GitHub.
Contents
Installation
Be aware that this algorithm requires extra pyton modules (numpy & pandas).
numpy & pandas should be installed with your QGIS installation. If not, they can be "pip install" from the QGIS command line (pip install numpy for numpy & pip install pandas for pandas).
Minimum modules version required to run this algorithm:
- numpy: >= V1.16.3
- pandas: >= 0.23.4
See here for installation instruction.
Once successfully installed the algorithm is found in the Processing toolbox under GeoProc -> composer -> Stacked profiles from point layer
Double-click "Stacked profiles from point layer" to launch the configuration window.
Parameters
The following screenshot shows the parameters needed to create stacked profiles:
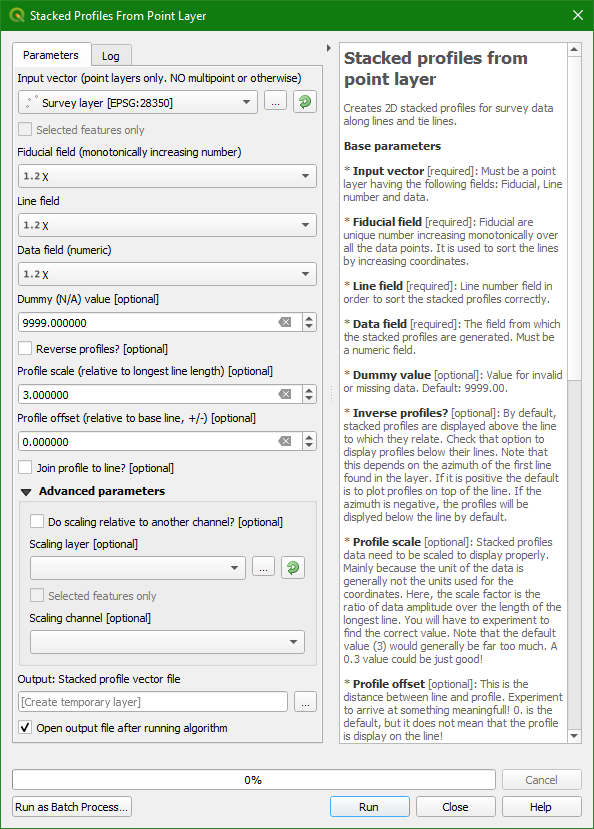
- Input vector [required]
- Must be a point layer having the following fields: Fiducial, Line number and data.
- Fiducial field [required]
- Fiducial are unique number increasing monotonically over all the data points. It is used to sort the lines by increasing coordinates.
- Line field [required]
- Line number field in order to sort the stacked profiles correctly.
- Data field [required]
- The field from which the stacked profiles are generated. Must be a numeric field.
- Dummy value
- Value for invalid or missing data. Default: 9999.00. There will be no profile point at that location, i.e. a straight line will connect the valid points on each side this invalid data point.
- Inverse profiles? [optional]
- By default, stacked profiles are displayed above the line to which they relate. Check that option to display profiles below their lines.
Note that this depends on azimuth value of the first line found in the layer. If it is positive the default is to plot profiles on top of the line. If the azimuth is negative, the profiles will be displyed below the line by default.
- Profile scale [optional]
- Stacked profiles data need to be scaled to display properly. Mainly because the unit of the data is generally not the units used for the coordinates.
Here, the scale factor is the ratio of data amplitude over the length of the longest line. You will have to experiment to find the correct value.
Note that the default value (3) would generally be far too much. A 0.3 value could be just good!
- Profile offset [optional]
- This is the distance between line and profile. Experiment to arrive at something meaningfull!
0. is the default, but it does not mean that the profile is display on the line!
- Join profile to line? [optional]
- By default profiles are "floating" over the lines. Check this option to link profiles ends to lines ends. This can be visually nicer!!
- Output [optional]
- The line vector layer created by the algorithm. See below.
Advanced parameters
- Scale profile relative to another channel?
- If you want to compare profiles from different channels in your layer you can then check 'Do scaling relative to another channel?'
and select the channel used for scaling the profiles. Default is False.
- Scaling layer
- If the previous option is checked, select the layer that has the channel to use for scaling. This is generally the same has the input layer. So re-select the input layer here.
The reason you have to re-select the layer is that you could create stacked profiles from a sub-set (selection) of the input layer and want to scale over the entire layer's data. Default: unused.
- Scaling channel
- If the previous option is checked, then select the channel to exctract the information from. Default: unused.
Results
A new layer is created by default in QGIS Layers pane. This is a line vector layer that can be styled as appropriate. It has six fields:
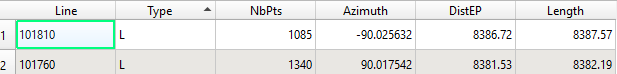
- Line: storing the original line number. Its coordinates are derived from the data channel used.
- Type: line type, either L or T for line and tie-line, respectively.
- NbPts: number of points in the profile.
- Azimuth: azimuth of the line. Positive clockwise from North.
- DistEP: distance between end points of the line.
- Length: length of the line (≥ DistEP).
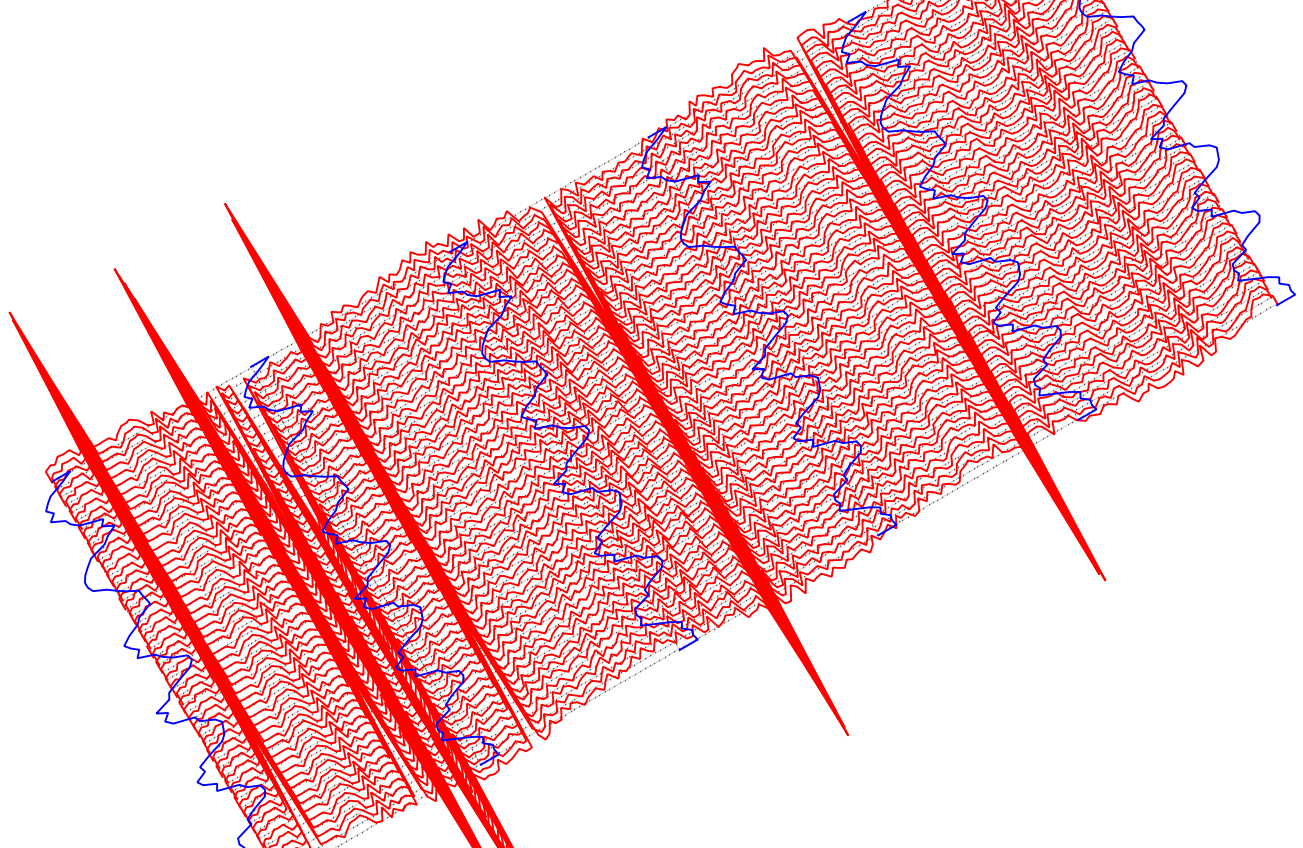
Display of randomly generated data as stacked profiles.Data generated with the random survey generator.
Click to enlarge
Change log
- V1.4: Add Dummy Value.
- V1.3: Add additional fields to output vector.
- V1.2: Better handling of profiles position relative to lines.
- V1.1: Better handling of lines direction.
- V1.0: Original public release.
Published date: 03 Jun 2019.

