bcCBar4: Colour Bar for One-Band Rasters 
V3.25 - 13 September 2022
This QGIS Processing algorithm creates a colour bar image file in svg format for a coloured 1-band raster. Use the created colour bar as legend in print composer.
Distributed under the GPL licence
This algorithm works only on QGIS version 3.24 and above
Is is not compatible with QGIS versions older than 3.24!
WARNING: Only works for the "Singleband pseudocolour" renderer. No other renderer as supported (including "Hillshade" renderer!)
This algorithm is part of the Processing geoprocAlgos plugin. Once installed the geoprocAlgos plugin can be found in the 'Processing toolbox'.
Please report any bug/problem/wish on GitHub or, not recommended, to the QGIS User mailing list [mailto: qgis - user at lists dot osgeo dot org].
Contents
Installation
Be aware that this algorithm requires extra pyton modules (numpy, matplotlib, pillow, beautifulsoup & lxml).
numpy & matplotlib should be installed with your QGIS installation, but pillow, beautifulsoup & lxml could require manual installation. They can be "pip install" from the QGIS command line (pip install pillow for pillow, pip install bs4 for beautifulsoup & pip install lxml for lxml).
For Windows users, another option is to install from 'wheels' from Christoph Gohlke's very resourceful site.
Minimum modules version required to run this algorithm:
- numpy: >= V1.16.3
- matplotlib >= V3.5.1
- pillow >= V5.3.0
- beautifulsoup >= V4.7.1
See here for installation instruction.
Once successfully installed the algorithm is found in the Processing toolbox under GeoProc -> Composer -> Create Colour bar:
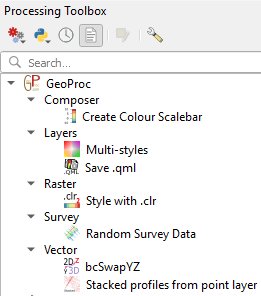
Double-click "Create Colour bar" to launch the configuration window:
Anatomy of a colour bar
A colour bar is made of the following elements:

Each element can be customised through optional parameters.
Parameters
Options are available to customise the generated colour bar. They are all optional and a default value is provided. Note that those default values are not optimum at all and fine tuning will be necessary...
The only required parameter is a 1-band raster in input. If you select a raster layer in QGIS legend before running this algorithm then it is automatically set as input. The raster must be a one-band raster styled with the "Singleband pseudocolour" renderer, otherwise the algorithm will fail.
By default the algorithm produces a horizontal colour bar with 5 ticks and labels (first, 1/4, 1/2, 3/4 and last colours) located at the bottom of the colour bar.
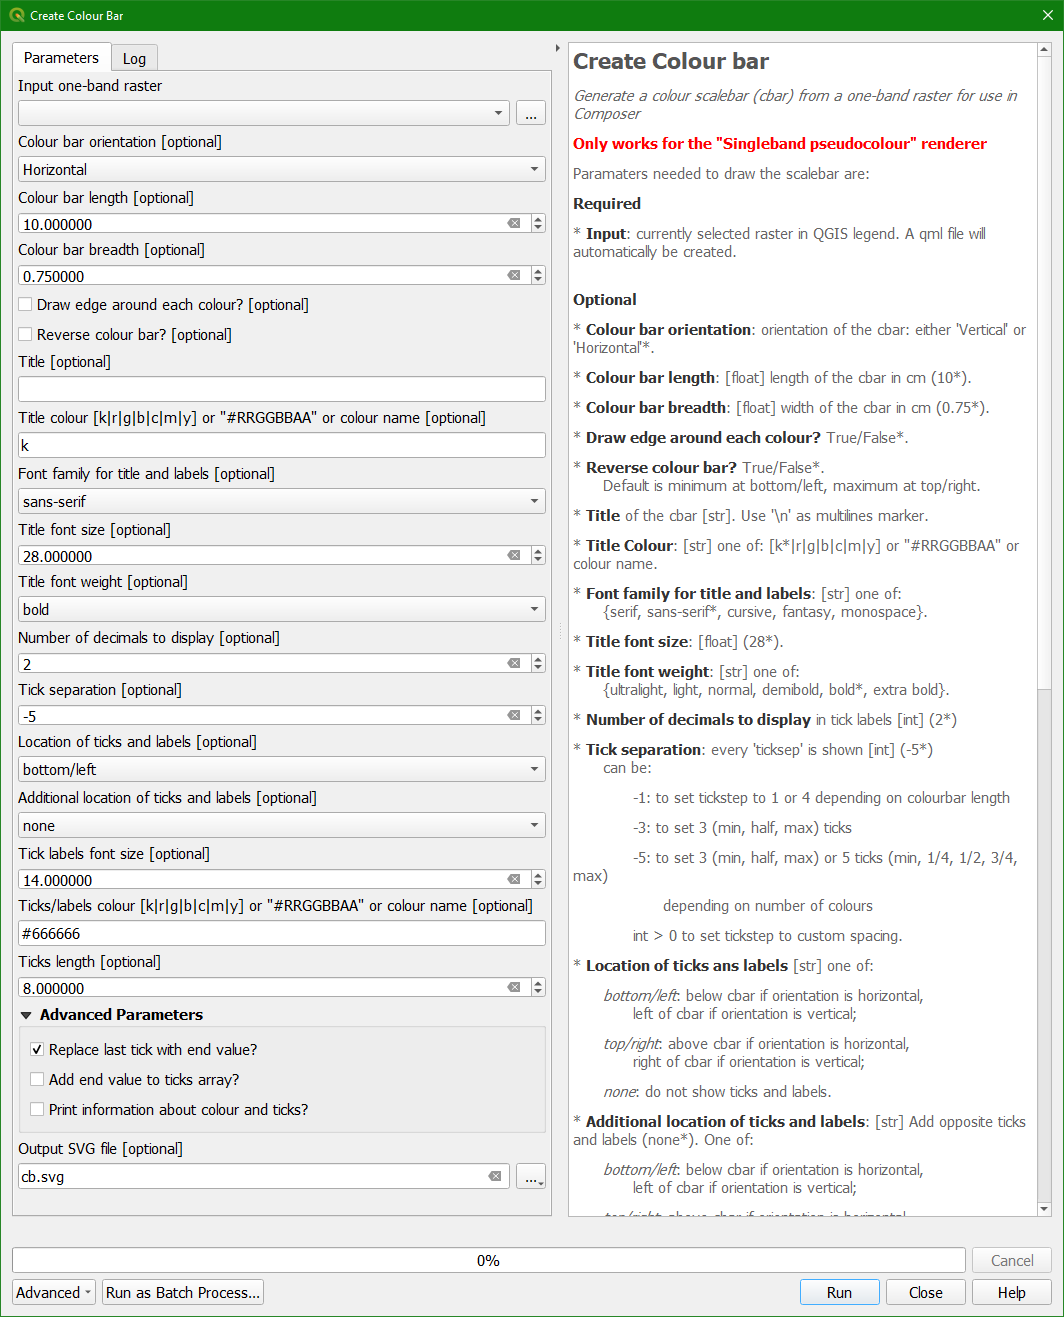
Parameters: (see figure above)
- Input one-band raster
- [str] full name of the raster layer to draw colour bar from. (required)
Optional parameters:-
- Output SVG file
- [str] name of the svg file storing the colour bar. (None)
If None (default) the raster layer source is used to set the svg name and the svg is saved into Processing temp folder.
- Colour bar
- colour bar orientation: [str] ('horizontal' | 'vertical'): colour bar orientation. (horizontal)
-
- Colour bar length: [float] colour bar longest dimension. (10)
- Colour bar breadth: [float] colour bar shortest dimension. (0.75)
- Draw edge around each colour?: [bool] draw box around each colour. (False)
- Reverse colour bar?: [bool] reverse the direction of the colour bar. (False)
- Title
- Title: [str] colour bar label. ('')
- Font family for title and labels: [str] font family: one of {serif, sans-serif, cursive, fantasy, monospace}. (sans-serif)
- Title font size: [float] title font size. (28.0)
- Title font weight: [str] title font weight: one of: {ultralight, light, normal, demibold, bold, extra bold}, (bold)
- Title colour: [str] title font colour: [k|r|g|b|c|m|y] or "#RRGGBBAA" or colour name. (k)
- Ticks and label:
- Tick separation: [int] show label every n ticks. (n = -5)
can be:
-1: to set tickstep to 1 or 4 depending on colourbar length
-3: to set 3 (min, half, max) ticks
-5: to set 3 (min, half, max) or 5 ticks (min, 1/4, 1/2, 3/4, max)
depending on number of colours
int > 0 to set tickstep to custom spacing.
- Number of decimals to display: [int] decimal places for tick labels. (2)
- Tick labels font size: [int] tick label font size. (14)
- Ticks/labels colour: [str] ticks/labels font colour: [k|r|g|b|c|m|y] or "#RRGGBBAA" or colour name. (#666666)
- Ticks length: [float] tick length. (8)
- Location of ticks and labels: where to place ticks and labels.
Left, Right or None for vertical colour bar. (left)
Bottom, Top or None for horizontal colour bar. (bottom)
- Additional location of ticks and labels: Ticks and labels can be duplicated on the other side of the colour bar. (None)
- Tweaking
- Replace last tick with end value?: [bool] replace last tick with end value. (True)
- Add end value to ticks array?: [bool] add end value to ticks array. (False)
- Debug parameter:
- Print information about colour and ticks?: [bool] Set it True for debug purposes only. (False)
(nn) is the default value for that parameter
Results
On completion, a svg file is created.
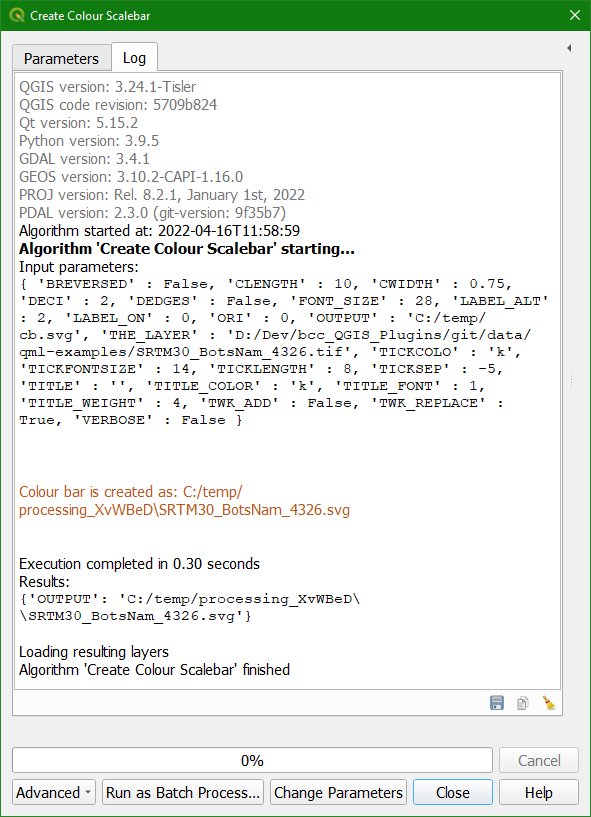
To import the colour bar into QGIS Composer do as follows:
- From the output of Processing, select the filename shown in orange/red (see image above)
- Copy it (Ctrl-C on Windows/Linux)
- In Composer, select the image object
 and draw a frame on the canvas.
- In 'Dynamic SVG parameters' click the little arrow and select 'Embed File...'
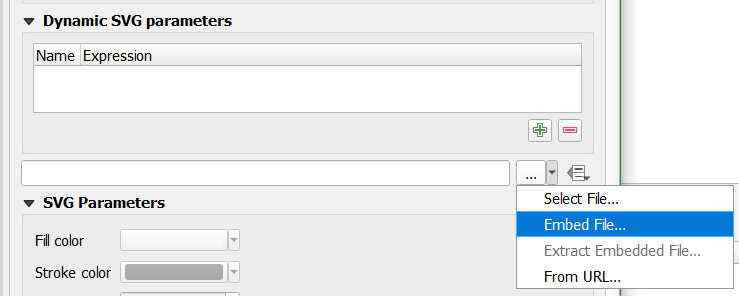
- Then paste (Ctrl-V on Windows/Linux) copied name into 'File name' and click 'Open'
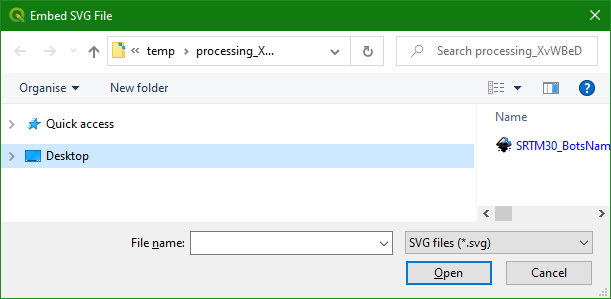
- Resize it to your liking and it is done!
Notes
- If default output is used, then the svg is created in Processing temporary directory. This means that on closing QGIS that directory is deleted and all files within it. If you want to keep the svg file, either give an output name or copy the content of the Processing directory somewhere else before closing QGIS.
- SVG:
“It is known that some vector graphics viewers (svg and pdf) renders white gaps between segments of the colour bar. This is due to bugs in the viewers, not Matplotlib.”
source: matplotlib documentation.
Change log
- 3.25: fix bugs in CBar: unexpected i18n number formatting problems.
- 3.24: Fix bug in CBar: type-conv for each entry, svg resizing, no png out.
- 3.23: Fixes.
- 3.22: Remove unavailable modules.
- 3.21: Polishing.
- 3.20: Original published.
Published date: 09 Sep 2022.

