bcCBar4: Colour Bar for One-Band Rasters 
V3.21 - 16 April 2022
This ipywidgets based Jupyter Notebook creates a colour bar image file in svg format from a QGIS V3.x .qml file saved from a 1-band raster layer.
qml files created with version of QGIS less than 3 will not work!!
Distributed under the GPL licence
Please report any bug/problem/wish on GitHub.
Contents
Installation
Download CBar4 project from GitHub here.
Included are: CBar4.ipynb notebook and cbar python module. Keep CBar4.ipynb and cbar folder in the same directory.
Jupyter Notebook or Jupyterlab must be installed. Please see your documentation on how to install one of these.
Furthermore, the following ipython modules must also be installed: 'ipywidgets' & 'ipyfilechooser'
This notebook is also dependent on the following pyton modules: numpy, matplotlib, pillow, beautifulsoup & lxml).
See your python distribution on how to install them.
You can use 'pip':
pip install numpy for numpy,
pip install matplotlib>=3.5.1 for matplotlib,
pip install pillow for pillow,
pip install bs4 for beautifulsoup
pip install lxml for lxml).
Minimum modules version required to run this algorithm:
- numpy: >= V1.16.3
- matplotlib >= V3.5.1
- pillow >= V5.3.0
- beautifulsoup >= V4.7.1
Anatomy of a colour bar
A colour bar is made of the following elements:

Each element can be customised through optional parameters.
Running
- Launch JupyterLab, navigate to the notebook and open 'CBar4.ipynb':
- Then 'Run All Cells'
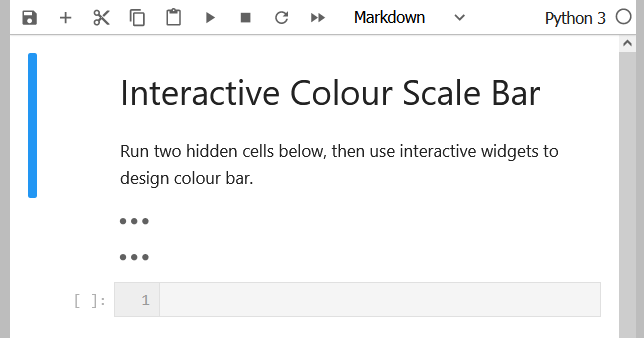
- A graphical interface is now displayed:
- Select a QGIS V3.x qml file and click 'Create colour bar' to quickly see how the default colour bar looks like

- Then customise the colour bar with the available options.
- When satisfied, copy the filename and open it in a SVG editor or use it somewhere else...
Parameters
Options are available to customise the generated colour bar. They are all optional and a default value is provided. Note that those default values are not optimum at all and fine tuning will be necessary...
The only required parameter is a QGIS V3.x qml file in input.
By default the algorithm produces a horizontal colour bar with 5 ticks and labels (first, 1/4, 1/2, 3/4 and last colours) located at the bottom of the colour bar.
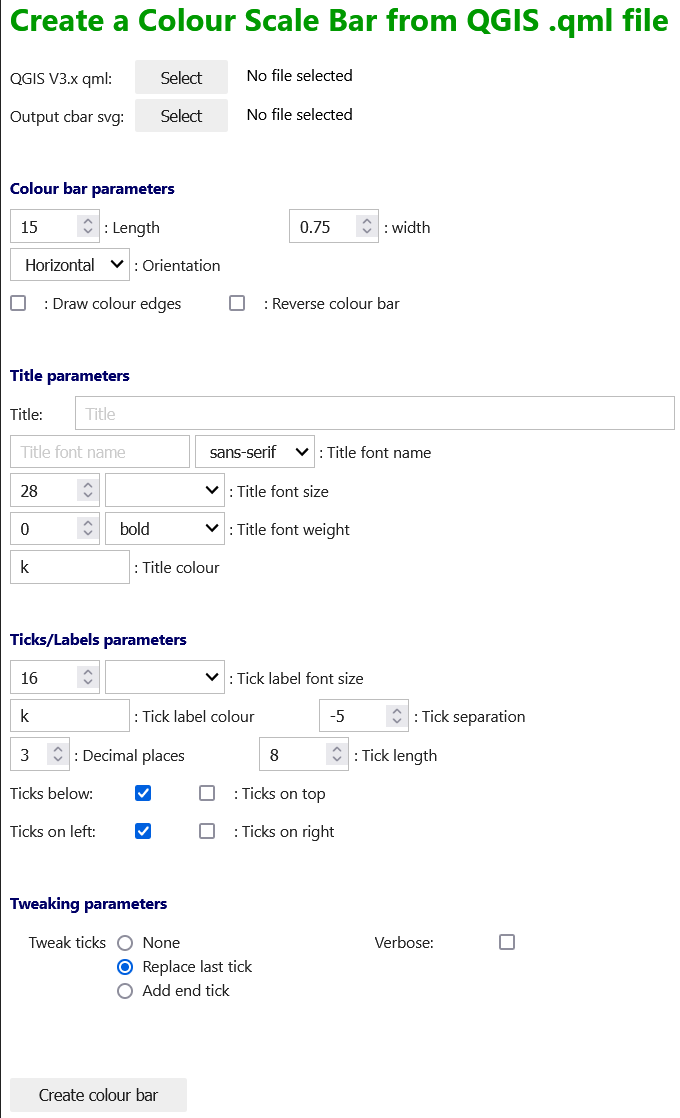
Parameters: (see figure above)
- QGIS qml file
- [str] Use to top 'Select' button to locate the QGIS qml file to use. (required)
Optional parameters:-
- Output SVG file
- Optionally select a svg filename using 'Output cbar svg:' 'Select' button
If None is selected (default) the qml filename is used to set the svg name.
- Colour bar
- Colour bar length: [float] colour bar longest dimension. (15)
- Colour bar width: [float] colour bar shortest dimension. (0.75)
- colour bar orientation: [str] ('horizontal' | 'vertical'): colour bar orientation. (horizontal)
-
- Draw colour edge?: [bool] draw box around each colour. (False)
- Reverse colour bar?: [bool] reverse the direction of the colour bar. (False)
- Title
- Title: [str] colour bar label. ('')
- Title font name: [str] font name/family for the title and the labels: FONTNAME or one of {serif, sans-serif, cursive, fantasy, monospace}. (sans-serif)
- Title font size: [int] title font size. (28)
- Title font weight: [str] title font weight: one of: {ultralight, light, normal, demibold, bold, extra bold}, (bold)
- Title colour: [str] title font colour: [k|r|g|b|c|m|y] or "#RRGGBBAA" or colour name. (k)
- Ticks and label:
- Tick label font size: [int] tick label font size. (16)
- Ticks/label colour: [str] ticks/labels font colour: [k|r|g|b|c|m|y] or "#RRGGBBAA" or colour name. (k)
- Tick separation: [int] show label every n ticks. (n = -5)
can be:
-1: to set tickstep to 1 or 4 depending on colourbar length
-3: to set 3 (min, half, max) ticks
-5: to set 3 (min, half, max) or 5 ticks (min, 1/4, 1/2, 3/4, max)
depending on number of colours
- Number of decimals to display: [int] decimal places for tick labels. (3)
- Ticks length: [float] tick length. (8)
- Ticks below: For horizontal colour bar, places ticks & labels below the colour bar. (True)
- Ticks on top: For horizontal colour bar, places ticks & labels above the colour bar. (False)
- Ticks on left: For vertical colour bar, places ticks & labels left of the colour bar. (True)
- Ticks on right: For vertical colour bar, places ticks & labels right of the colour bar. (False)
- Tweaking
- Replace last tick: [bool] replace last tick with end value. (True)
- Add end ticks: [bool] add end value to ticks array. (False)
- Debug parameter:
- Verbose: [bool] print information about the colours and ticks. (False)
(nn) is the default value for that parameter
Results
On completion, a svg file is created.

Notes
- SVG:
“It is known that some vector graphics viewers (svg and pdf) renders white gaps between segments of the colour bar. This is due to bugs in the viewers, not Matplotlib.”
source: matplotlib documentation.
Change log
- 3.25.2: First public release. 2022-04-16
Published date: 16 Apr 2022.

